Water Quality with respect to Iraq’s water resources; Uses for Agriculture and Human applications

Water Quality with respect to Iraq’s water resources; Uses for Agriculture and Human applications
Nadhir Al-Ansari[1], Nasrat Adamo1
1Lulea University of Technology, Lulea, Sweden. nadhir.alansaritu.se,
2 Nasrat Adamo, Consultant Engineer, Sweden. [email protected],
Abstract
Euphrates and Tigris Rivers are the longest two rivers in southwest Asia. The Basins of these rivers cover an area of 917 103 km2 which is occupied by about 46 million inhabitants. Four countries (Turkey, Iran, Iraq and Syria) share the basin area of the Tigris River and the other four (Turkey, Syria, Iraq and Saudi Arabia) share the catchment area of the Euphrates River. The flow of the two rivers is decreasing with time due to construction of dams in the upstream part of the basins and climate change. This has impacted the water quality of the two rivers. Iraq is highly affected followed by Syria. The salinity of Tigris Rivers has become alarming downstream Baghdad while the Euphrates water quality deteriorates before entering the Iraqi border. To overcome water quality deterioration, international, regional and national cooperation is required to reach prudent planning for water resources management of the two basins.
Key words: Euphrates River, Turkey, Syria, Iraq
1 Introduction
The Middle East and North Africa region is considered arid to semi-arid area where annual rainfall does not exceed 166mm/year (Al-Ansari and Knutsson, 2011; Roger and Lydon 1993). Most of the countries within this region suffer from water shortage problems. Available water resources cannot fulfill the requirements of the population (Shahin, 2007).
This region is one of the most vulnerable to climate change (Arab Forum for Environment and Development; AFED, 2009). According to recently published data, the Middle East will experience higher temperatures and lower annual precipitation (Al-Ansari et.al.,2014a, b; Osman et.al., 2017a, b; Al-Ansari, 2013, 2016; IPCC, 2007). In addition, severe shortages of both surface and ground water resources are expected in future (Voss et.al, 2013; Chenoweth et.al 2011; Al-Ansari et al, 1999; Bazzaz, 1993).
Water demand will increase in future due to the high population growth rate where it is 2.31% and 2.44% in Syria and Iraq, respectively (Shahin, 2007), yet
they have unrealistic aspirations of food self-sufficiency which made the agricultural sector the largest water consumer (Hiniker, 1999). The expansion in agricultural activities has caused serious water quality problems particularly in the Tigris and Euphrates basins (ESCWA, 2013). Note that the socio-economic stability at the national and regional levels is closely related to water issues in the Middle East.
The catchments of the Tigris and Euphrates Rivers include five countries in the Middle East, Southwest Asia. These countries are: Turkey, Syria, Iran, Saudi Arabia and Iraq (Figure 1 and table 1). The total catchment area of the two rivers is 917103 km2 it was occupied by about 46 million inhabitants (ESCWA, 2013) and the number is higher now. The two rivers rise from the southeastern parts of Turkey and for this reason Turkey has become hegemonic riparian party of the two basins.
According to Wikipedia (2018), the lower parts of these basins are referred to as the “Mesopotamian Plain”. The name has come from the early Greek language where “meso” means middle and “potamos” means rivers and this was used by the Greek historian Herodotus (484–425 BC) in his writings. The name therefore means the land between the two rivers. Furthermore, the Mesopotamia Plain can be divided into two regions (upper and lower). The former is the area known as “Jazira” which lies between the two rivers from their source to Baghdad. The latter, represents the area from Baghdad to the Gulf.
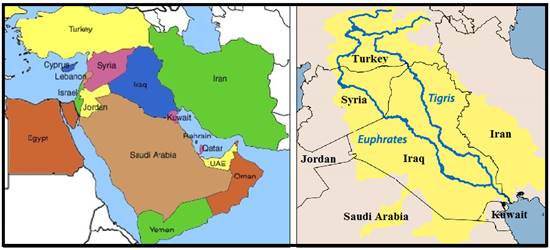
Figure 1: Tigris and Euphrates Basins.
The flow of the Tigris and Euphrates Rivers available for use is decreasing with time (see Al-Ansari and Knutsson, 2011; Al-Ansari, 2013, 2016; ESCWA, 2013; Abdulhadi, 2015). This decrease is partly associated with an increase in water salinity. In this work, the reasons of this phenomenon are discussed. In addition, the sources causing pollution of the water of these rivers are explained.
Table 1: Tigris and Euphrates Basins
| Countries | Tigris River | Euphrates River | ||
| Catchment area | Catchment area
| |||
| (km2) | (%) | (km2) | (%) | |
| Turkey | 57614 | 12.2 | 125000 | 28.2 |
| Syria | 834 | 0.2 | 76000 | 17.1 |
| Iraq | 253000 | 58 | 177000 | 39.9 |
| Iran | 140180 | 29.6 | – | – |
| Saudi Arabia | – | – | 66000 | 14.9 |
| Total | 473103 | 100 | 444000 | 100 |
2 River Tigris
The Tigris River is the second longest river in southwest Asia (Figures 1 and 2). It runs for about 400 km in Turkey and then forms about 47 km as the border between Turkey and Syria before it enters the Iraqi territory (ESCWA, 2013). Its flow records at the Turkish Syrian – Iraqi border indicate that its annual flow is 21 BCM. Turkey plans to use 14.1% of the Tigris water to which it contributes 52%, while Syria aims at using 4.5%. Finally, Iraq would like to use 92.5% of the river water and it contributes about 23% of its resources. (http://www.mfa.gov.tr/data/DISPOLITIKA/WaterASourceofConflictofCoopintheMiddleEast.pdf ).
Turkey started through the Southeastern Anatolia Project (GAP) to use the Tigris water for irrigation and hydroelectric schemes. Turkey aims to irrigate about 600000 ha within the Tigris basin which means that 5.6 BCM of water is to be consumed (ESCWA, 2013). The present situation indicates is that only 42000 ha are under irrigation now and 53000 ha are under construction (ESCWA, 2013).
In Syria which is the minor riparian on the Tigris, the development is restricted. The main use of the river water is for domestic purposes. In 2010 however, and according to the agreement of cooperation between Iraq and Syria, the first phase of one irrigation project was implemented. According to this agreement, Syria can use 1.25 BCM a year to irrigate an area of 15000 ha in Hasakah Governorate (ESCWA, 2013).
In Iraq, the Tigris River has 5 main tributaries (Figure 2, Table 2). The river irrigates about 4 million ha of land (ESCWA, 2013).
Due to salinity and water logging problems, Iraq started to focus on land reclamation in the 1980s. About 1 million ha of agricultural area was reclaimed and 1.5 million ha of land was semi-reclaimed. Future projects include the reclamation of 920,000 ha and irrigation of 134,000 ha (ESCWA, 2013).
The flow of the River Tigris started to decrease with time due to the increase of agricultural activities, building of dams in Turkey as well as climate change (Figure 3). The decrease of flow is accompanied by deterioration of the water quality due to the increase in salinity and other pollutants (Figure 4). Long term records indicate that water quality of the river is acceptable within Turkey. Deterioration starts to be alarming once the river enter Iraq where steady increase can be noticed along the river. At Baghdad, the quality becomes unsuitable for irrigation (Figure 4). Downstream Baghdad, the situation becomes more alarming where the salinity increase becomes more pronounced.
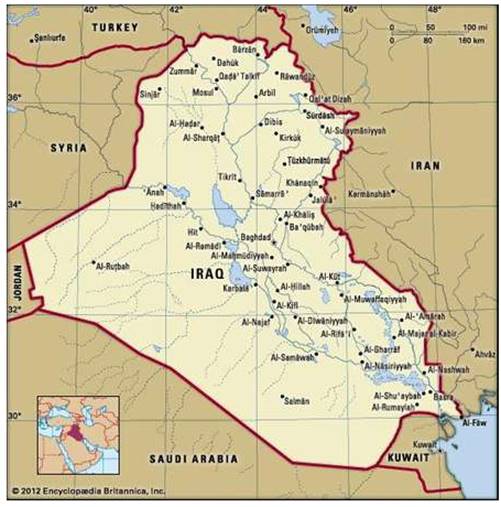
Figure 2: Tigris and Euphrates Rivers.
Table 2: Main shared Tributaries of the River Tigris in Iraq.
| Tributary | Mean Annual Flow (BCM) | Catchment Area (km2) |
| Khabour | 2 | 6,143 (Turkey 57%, Iraq 43%) |
| Greater Zab | 12.7 | 26,310 (Turkey35%, Iraq 65%) |
| Lesser Zab | 7.8 | 19,780 (Iran 24%, Iraq76%) |
| Adhaim | 0.79 | 12,965 (Iraq100%) |
| Diyala | 4.6 | 33,240 (Iran 25%, Iraq75%) |
| Tib | 1 | Iran, Iraq |
| Dwairij | 1 | Iran, Iraq |
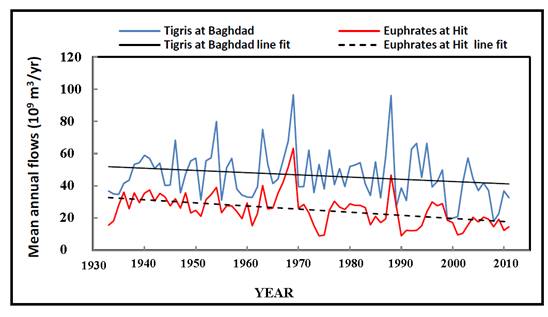
Figure 3: Long-term flow of Tigris and Euphrates Rivers (modified Abdullah, 2016)
Consulting Engineering Bureau (CEB) (2011) documented the water quality data for the River Tigris for the period 2000 – 2010 (Figure 5). In addition, the records of the Iraqi Ministry of Environment show water quality data for the River Tigris downstream Baghdad for 2015 and 2016 (Figure 6). It can be noticed that the salinity within both periods is similar to that of the long-term records given by ESCWA (2013). Downstream Baghdad the situation becomes more alarming.
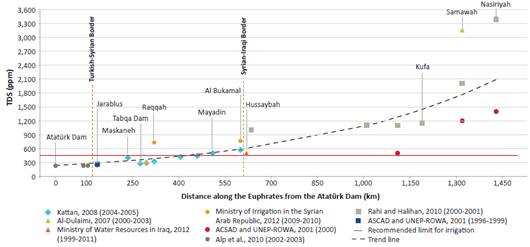
Figure 4: Salinity variation along the River Tigris (ESCWA, 2013).

Figure 5: Salinity variation along the River Tigris for the period 2000-2010 (data from CEB, 2011)
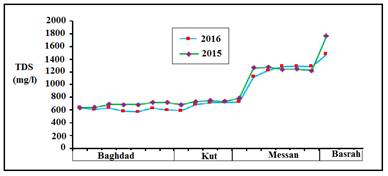
Figure 6: Salinity variation along the River Tigris for the period 2015-2016 (data from Iraqi Ministry of Environment records).
3 River Euphrates
The Euphrates River is the longest river in south west Asia with a total length of about 2786 km. The main riparian countries are Turkey, Syria and Iraq. The river rises from area located southeast Turkey. It runs about 1,200 km in Turkey, 700 km in Syria and 1,000 km in Iraq. Its annual flow is 30 BCM at the Turkish- Syrian border according to historical records; however, it started to decrease since the 1970s due to dams’ construction in Turkey and Syria (See figure 3). Turkey contributes 89% of the Euphrates water and plans to use 52% while Syria and Iraq want to use 32% and 65% of the water respectively. http://www.mfa.gov.tr/data/DISPOLITIKA/WaterASourceofConflictofCoopintheMiddleEast.pdf
During the 1960s, Turkey started building Keban Dam on the Euphrates River, which was completed in 1974. Since then, it started its huge project “GAP” and the second dam “Karakaya “was built in 1984 which was followed by two more dams. Future planning in this country is to build 14 dams and 11 hydroelectric stations (ESCWA, 2013). Now, there is 230000 ha of land under irrigation from the Euphrates River in Turkey which are to be increased to reach 1.8 million ha at the final completion of GAP project.
Like Turkey, Syria started to utilize the water of the Euphrates River during the 1960s. The River Euphrates has three main tributaries in Syria (Table 3). Few projects were implemented on the main river and its tributaries to irrigate an area of about 300000 ha, and other projects are under construction and design to irrigate further 253115 ha of land (ESCWA, 2013). In addition to irrigation projects, there are several cities that depend on the water of the Euphrates River for domestic use and drinking like Deir ez Zor and Raqqah.
Table 3: Shared tributaries of the Euphrates River (ESCWA, 2013)
| Tributary | Mean Annual Flow (MCM) | Catchment Area (km2) |
| SAJUR | 98 | 2,860 (Syria 40% Turkey 60%) |
| BALIKH/J ALLAB | 140-210 | 13,600(Syria 38% Turkey 62%) |
| KHABOUR | 924 | 36,200 (Iraq 6% Syria 66% Turkey 28% |
Iraq was the first riparian country to utilize and use the water of the Euphrates River. Its irrigation projects areas were 5 and 10 times as much as the irrigated areas in Syria and Turkey respectively (ESCWA, 2013). The total estimated area that can be irrigated within the Euphrates basin can reach 1.8 million ha (Kliot, 1994) while other estimates put this at 4 million ha (ESCWA, 2013). In the 1960s the irrigated areas from the river between Hit and Hindiya were 1.2 million ha which required 16 BCM. These figures are decreasing now due to the decrease of the river flow which reached about 4 BCM now (Al-Ansari, 2013).
Like the Tigris River, the Euphrates River shows a continuous decline in its water quality along the downstream (Figure 7). This is due to the construction of dams and climate change. The water quality of the river remains acceptable within Turkey. Once the river passes Raqqah city in Syria, the salinity increases to unacceptable levels where it becomes higher than what is recommended for irrigation (Figure 7).

Figure 7: Salinity variation along the River Euphrates (ESCWA, 2013).
About 450 km downstream the Syrian – Iraqi border, the increase of salinity becomes more rapid. This is believed to be due to return flows from irrigation projects and partly due to the use of the Tharthar lake saline water to supplement the Euphrates River flow. The cause of the increased salinity in the Euphrates River south of Shanafiya is the drainage water from three main drains which are not linked yet to the main outfall drain which is called the Third River and instead they discharge directly to the river. Ten years’ records for the period 2000 to 2010 show that the salinity is generally exceeding 500 mg/l for the Euphrates water at the Syrian Iraqi border (Figure 8) (CEB, 2011). The salinity increases to 3000 mg/l downstream Babylon. This is due to the intensive agricultural activities within this area. Recent data from the files of the Iraqi Ministry of Environment for the years 2015 and 2016 showed similar trend (Figure 9).
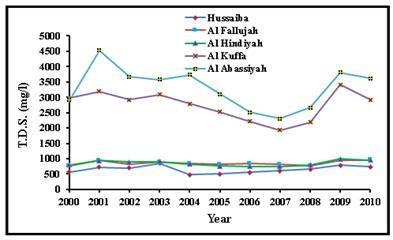
Figure 8: Salinity variation along the Euphrates River for the period 2000-2010 (sources of data CEB ,2011).
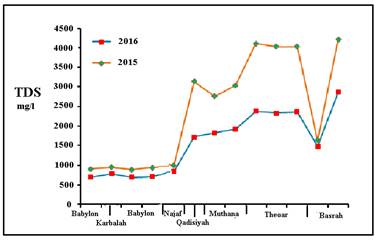
Figure 9: Salinity variation along the Euphrates River for the period 2015 and 2016 (sources of data: files of the Iraqi Ministry of Environment).
4 Causes of Water Quality Deterioration
4.1 Construction of Dams
Construction of dams and the implementation of irrigation projects in the Tigris and Euphrates basins have had significant impact on the society and the environment. The constructed dams in Turkey within the GAP project plans have a total storage capacity of 100 km3 while in Syria the reservoirs have a capacity of 16.1 km3. These huge water bodies in an arid to semi-arid environment will increase the rate of evaporation. Hillel (1994) estimated the loss due to evaporation from the existing reservoirs on the Euphrates River to be 8 km3/y. This phenomenon will steadily increase salinity and decrease the volume of flow. Filling the reservoirs of these dams had hard negative implications on downstream riparian countries. Before 1990, Syria used to receive 29 km3 of water from the Euphrates River which dropped after 2000 to about 2 km3 (Mageed, 1993). Similarly, Iraq was also effected with the flow of the Euphrates dropping from 29 km3 to about 4 km3 (about 90% reduction). As a result, agricultural lands in Syria and Iraq were reduced from 650,000 hectares to 240,000 hectares. As far as the Tigris River is concerned, it is expected that 696,000 hectares of agricultural land will be abandoned due to the reduction of flow when Ilisu dam is put in operation, then Iraq will receive only 9.7 km3 (Alalaf, 2009). This has resulted so far in few incidents of high tension and friction between riparian countries when the reservoirs of dams were filled and resulting in tremendous decrease in the flow (Akanda et al, 2007; FAO, 2009c; Alsaka, 2014; Al Bomola, 2011).
Iran has so far diverted the water of almost all the valleys coming to Iraq inside the Iranian borders due to water shortage problems in Iran (Sharifikia, 2013, Al-Shaab, 2017, Proyect, 2018). In addition, the water of Karun and Karkha Rivers were also diverted inside the Iranian borders. These rivers used to contribute 24.5 and 5.8 billion cubic meters (BCM) annually, respectively (abdulah, 2016). These caused increase of the salinity within the lower reaches of the Tigris River and Shatt Al-Arab River.
4.2 Al-Tharthar Scheme
Al-Tharthar lake is located between the Tigris and Euphrates Rivers at the middle of Iraq. Its water is saline brackish where the total dissolved salts concentration is about 2500 ppm due to the dissolution of gypsum rocks forming its banks and floor. Its storage capacity is about 85 km3 with a surface area of about 2050 km2 and it is about 120 km long and with a maximum width of about 48 km (Figure 10) with a floor of – 3 m, bellow the sea level (Sissakian, 2011). This depression has been used to store access water from the Tigris River during floods since 1956. The capacity of the canal that transfers water from the Tigris at Sammara barrage to Al-Tharthar reaches 9000 m3/s. The remainder quantity of water is passed through downstream to Baghdad through that barrage. Later in the 1980ies, this lake was used to back up the water shortages in both the Euphrates and the Tigris Rivers through a 28 km long canal. This canal splits into two branches: the first one is Dhir’aa Dijla which transfers water back to the Tigris River at Al Taji north of Baghdad, and Dhir’aa El-Furat which transfers water back to the Euphrates River (Figure 10). The mixing of Al-Tharthar lake brackish water with the river waters led to an increase of the salinity in these rivers.
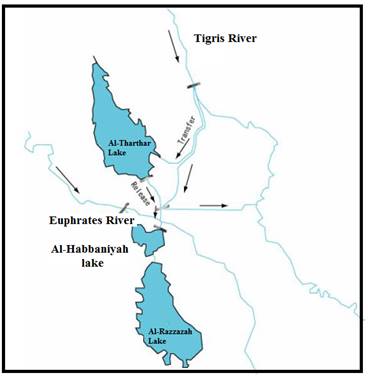
Figure 10: Diversion system between Tigris and Euphrates (modified after Ministry of Environment, 2010).
4.3 Agriculture and Irrigation
Due to high population growth rates and rapid development within the riparian countries, the governments tried to attain food self-sufficiency by implementing large and huge irrigation projects (Table 4). As a consequence, agriculture became the largest water consumer in these countries where it reached (78, 88 and 73) % in Iraq, Syria and Turkey respectively (FAO, 2009a, b, c). In addition, all riparian counties suffered from salinity-alkalinity and waterlogging problems caused by irrigation and insufficient drainage systems (FAO, 2009a, b, c). The return water flow from irrigation projects negatively affected the water quality particularly within the Euphrates basin (FAO, 2009 c).
In the southern part of Iraq, salinity problems were reported since Sumerian times. The water table in this area is high and over irrigation brings it up to the roots of the crop. This has destroyed the crop in large areas in Iraq and to overcome this problem, it will take several years (Schnepf, 2003). The Iraqi Government has already constructed a main outfall drain (MOD) which is known as the “Third River” that runs from Mahmudiya south of Baghdad to the Gulf for a distance of 565 km to carry drainage water from irrigation projects from 150000 km2 with a discharge capacity of 210 m3/s (Figure 11) (UNEP, 2003; Shahin, 2007). Networks and sub-surface tile drains and surface drainage canals were constructed to collect drainage water from agricultural fields and dump it in the MOD to overcome salinization and water logging problems (FAO, 2003, Taylor and Francis Group, 2003).
Table 4: Water consumption within riparian countries of Tigris and Euphrates Basins (Source FAO, 2009a, b, c)
| Population | Cultivated area (ha) | Water withdrawal (MCM) | |||
| Irrigation and livestock | Municipalities | Industry | Total | ||
| Iraq | |||||
| 28807000 (2005) | 6010000 | 52000 (78%) | 4300 | 9700 | 66000 (2000) |
| Syria | |||||
| 19 043 000 (2003) | 5 742 000 | 14 669 (88%) | 1 426 | 595 | 16 690 (2003) |
| Turkey | |||||
| 73193000 (2003) | 26606000 | 29600 (73%) | 6200 | 4300 | 40100 (2003) |

Figure 11: New drain system in Iraq (Kavvas et al., 2006)
4.4 Wastewater
In Iraq, 14 cities have waste water treatment plants out of 252 cities with a capacity of 350000 m3/day which serve 8% of the population (World Bank, 2006). Most of the sewerage systems need replacement, rehabilitation and upgrading and about 70% to 83% of the sewage water is directly discharged to the rivers (World Bank, 2006; Geopolicity, 2010).
About 26% of the population in Iraq are served through public sewerage networks while 50% through septic tanks and 7.1% and 15.1% through covered and open drain respectively (Al Bomola, 2011). Toilets are connected to the sewer system or septic tanks (MICS, 2011) and most of these do not function properly where there is an overflow of effluent to the environment (UNICEF, 2003). About 83% of the wastewater is directly discharged to the rivers (Geopolicity, 2010).
Waste water is discharged to rivers from industrial factories as well where there are more than 137 factories on the banks of the rivers in Iraq (Al Bomola, 2011, Alsaka, 2014).
4.5 Waste of Wars
Iraq went through two devastating wars in 1991(Gulf War I) and 2003 (Gulf War II) during which new weapons were used called Depleted Uranium (DU). In the second war, the quantity of DU bombs used was five times more than what was used in the first war. More than 1100 to 2200 tons of DU were used in 2003 (Zwijnenburg, 2013). The targets that were bombed with DU weapons were spread all over Iraq (Figure 12). More details about these sites are given by Zwijnenburg (2013), Almuqdadi and Al-Ansari (2013a&b), Ali (2013), Al-Daghastani (2013) and Fathi et al (2013). The southern part of Iraqi is highly contaminated relative to other areas (Al-Ansari et al., 2014c).
During the two wars, civilian facilities (power plants and refineries) were also bombed. Legacy of the contaminants are either transient or long lived (Figure 13). During these wars, the Iraqi troops left plenty of ammunitions and poisonous gas in the marshe area south Iraq (Sluglett, 2003; Tkachenko,2003; DAI Washington, 2006). UNEP (2003) stated that there are about 300 polluted locations in Iraq of various types (Table 5).
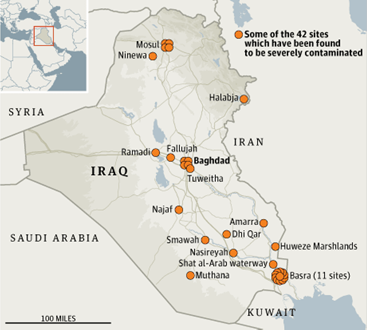
Figure 12: Contaminated sites in Iraq with DU (Chulov, 2010)
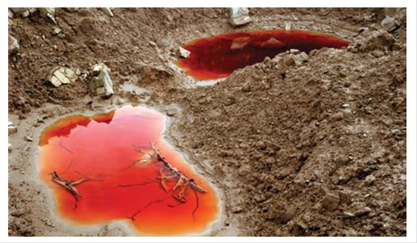
Figure 13: Unburnt trinitrotolluine (TNT). Iraqi Army ammunition storage depot, Missan Governorate, south eastern Iraq, 2004 (Zwijnenburg, 2013).
Table 5: The hot-spot sites and oil polluted sites in Iraq (UNEP, 2003).
| No. of sites | |
| Conventional Army Industry | 38 | |
| Oil production and export | 15 | |
| Oil and Chemical refining | 6 | |
| Mining | 2 | |
| Agriculture/Pesticides | 1 | |
| Steel | 1 | |
| Cement | 16 | |
| Chemicals (excluding arms-related) | 6 |
4.6 Climate Change
Riparian countries of the Tigris and Euphrates basins are highly affected by climate change (Al-Ansari et.al.,2014a, b; Osman et.al., 2017a, b; Al-Ansari, 2013, 2016; IPCC, 2007). Analysis of rainfall long term records show that the annual average rainfall is decreasing with time (Figure 14) (Al-Ansari et.al., 2014d). This will have serious consequences on the river basins. As an example 71% of the water of the Euphrates River is from precipitation in Turkey (UNDP, 2011). Decrease of rainfall is associated with increase in temperature (Al-Ansari, 2013). These trends suggest more evaporation and there will be more drought periods. Iraq has already experienced few drought periods (Figure 15) (UNEP, 2011, Hameed et al., 2018). In addition, intensive rainfall events will take place. This implies negative consequences where groundwater recharge will be decreased due to the decrease in infiltration rates in short periods of time. As such rainfall events takes place after drought periods, then sediment erosion will be increased tremendously. This will minimize the land production due to intensive soil erosion and it will decrease the storage capacity of reservoirs.

Figure: 14 Average annual rainfall for (a) A2 scenario and (b) B2 scenario compared with control period (Al-Ansari et. Al., 2014d).
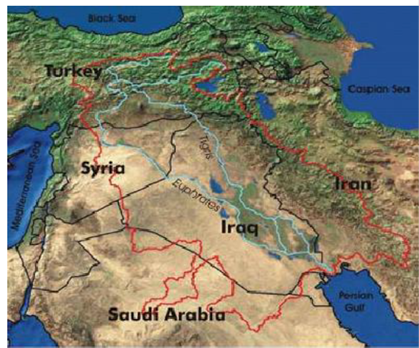
Figure 15: A recent map of the Middle East that shows the wide spread Drought with brown color (UNEP, 2011).
Other implications of climate change are dust storms (Figure 16). This will lead to aerosol pollution which will change the properties of the clouds and reduces precipitation. In the past few years, Iraq and neighboring countries experienced plenty of dust storms. The reduction of flow of the Tigris and Euphrates Rivers, the drying of marshes and military operations had also enhanced the formation of these storms.
Future predictions indicates that the countries of the Middle East will be most water stressed by 2040 (Maddocks et al., 2015). All countries within the Tigris and Euphrates basins lie within this category. Iran will have relatively the maximum water stress followed by Iraq, Syria and Turkey (Maddocks et al., 2015).

Figure 16: Aerial view of a dust storm. Note it had started just in the northwestern borders of Iraq (The Moderate Resolution Imaging Spectroradiometer (MODIS) on NASA’s Aqua satellite captured this natural color image on March 3, 2011) (after Sissakian et.al., 2013).
4.7 Solid Waste
Huge quantities of solid waste are generated in all riparian countries (Al Bomola, 2011). The waste is of different types and origins (Table 6). These wastes are not dumped in properly designed landfills. As a consequence, they end up in roadsides or floating on surface water (Al Bomola, 2011). In addition, clinical waste which is supposed to be treated and disposed and burned in special medical incinerator is also mixed with domestic waste. This is due to the fact that most of hospitals in Iraq either do not have incinerators or in those hospitals that which have them 90% of these incinerators are not functioning (Al Bomola, 2011).
Table 6: Types of solid waste (Al Bomola, 2011).
| Type of solid waste | Most materials |
| Refuse
| Commercial, industrial and residential waste |
| Garbage
| Food waste and organic material |
| Rubbish
| Tin cans, glass, paper, wood cloth grass |
| Ashes
| Resulting from coal for cooking and heating |
| Trash
| Tree, branches and big boxes |
4.8 Population Growth
Riparian countries of the Tigris and Euphrates basins including Iran where some of the Tigris tributaries are located inside its borders are highly populated (Table 7) (Worldmeters, 2018). Most of the population particularly in Syria and Iraq live in narrow areas near the banks of the rivers. The high population growth rates in Syria and Iraq will increase the future demand for water where the population will be more than doubled in 2050 (Table 7) (Wikipedia, 2018; Population Reference Bureau, 2015). This will increase the demand on water and also increase water consumption. As a consequence, the probability of water pollution will increase as well as the stress for water (Figure 17) (UN Water, 2016).
Table 7: Present and future Populations in countries within the Tigris and Euphrates basins.
| Country | Population 2018 and Yearly change | Expected Population | ||||
| 2030 | 2050 | |||||
| Iraq |
2.78 % | 54.071** 53.4*** | 83.652** 76.5*** | |||
| Iran | 82,011,735* 1.05 % | 88.559** 90.2*** | 92.219** 99.3*** | |||
| Syria |
0.08 % | 28.647** 26.1*** | 34.902** 10.4*** | |||
| Turkey |
1.45 % | 87,717** 88.4 *** | 95,819** 93.5*** | |||
| *Worldmeters, Countries in the world by population (2018) http://www.worldometers.info/world-population/population-by-country/ **Wikipedia, List of countries by future population (United Nations, medium fertility variant) https://en.wikipedia.org/wiki/List_of_countries_by_future_population_(United_Nations,_medium_fertility_variant) ***Population Reference Bureau, 2015, World Population Data with a special focus on women’s http://www.prb.org/pdf15/2015-world-population-data-sheet_eng.pdf
| ||||||
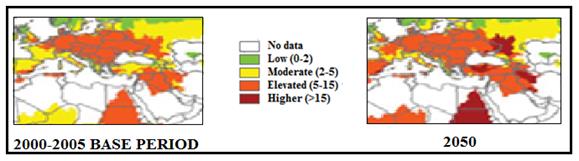
Figure 17: Water quality risk indices for major river basins during base period (2000-2005) compared to 2050 (Modified from UN Water, 2016).
5 Discussion
There are several factors affecting the water quality of the Tigris and Euphrates Rivers. The most important factors are: construction of dams in the upstream riparian countries and climate change. These factors decreased the flow in both rivers, increased evaporation rates as well as bringing saline return irrigation flows. There are other factors that contributed to the salinity of water in the rivers like: population growth rate, discharging wastewater and solid waste, diverting AlTharthar water to the rivers and remnants of the wars.
Syria is moderately affected while Iraq is highly affected due to its geographical position as the last downstream riparian country within the Tigris and Euphrates basins. UNDP (2011) summarized the negative impact of water shortage and droughts on Iraq as follow:
– The agriculture is severely affected where agricultural land decreased (Figure 18). People were deepening shallow wells in attempt to get water.
– Economic activities in production of commodities and provision of services that can be accomplished or sustained without the availability of water.
– The social well-being: the water is needed to meet the basic requirements of human and animal lives, to preserve the environment, and to maintain acceptable personal and hygienic levels and standards.
-Desertification: The areas of desertification in Iraq have increased as a result of drought.
-Sand dunes increase and recurrence of sandstorms.
– Hydropower: The suspension of electric power systems at dams due to water shortages have affected the industrial and infrastructure water purification stations and oil refineries and other industries that rely on the hydropower generated at dams.
-Sanitation: Problems of sanitation occurred in Tigris and Euphrates Rivers due to untreated sewage disposal, which lead to water pollution. There is increasing concern about the spread of waterborne diseases and the increase in concentration of contaminants as untreated sewage pours into the rivers and as the volume of water declines. Also, decreasing of water levels in rivers has negatively affected the efficiency of intakes and catalyzed the growth and gathering of excessive plants & duckweeds around intakes and then disrupting the treatment processes in most of water projects. Decreasing levels in lakes has led to slack water and increase the possibility of pollution.
– Salinity: Low level of water has increased the salinity in many of the agricultural areas around the rivers and streams.
Future expectations are gloomier. Reports indicate that Turkey, Syria, Iran and Iraq will be among the most water stressed countries in 2040 (Maddocks, et al., 2015). Iran will be relatively having the highest stress followed by Iraq, Syria and Turkey. In case riparian countries (Turkey, Iran and Syria) execute all their water projects utilizing the Rivers Tigris, Euphrates and their tributaries, then the rivers will be completely dry in Iraq by 2040 (UN, 2010). As far as the water quality is concerned, Iraq will remain at elevated risk till 2050 (Figure 17) (UN Water, 2016).
To overcome these problems serious actions are to be taken by riparian countries to minimize and mitigate the effects of water shortages and to reduce the rates of increase in water consumption. These actions require international, regional and national cooperation.
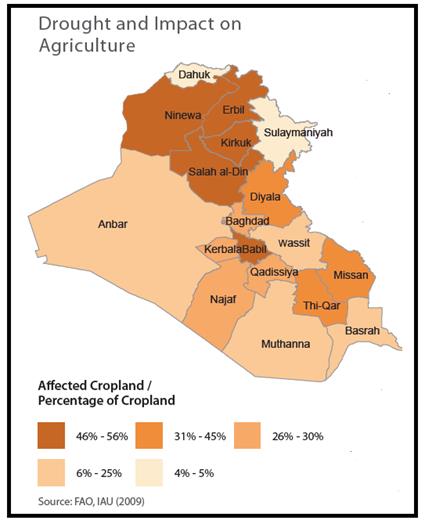
Figure 18: Drought and its Recent Impact on Agriculture throughout Iraq (Adapted from IAU,2010)
6 Conclusions
The flow rates of Tigris and Euphrates Rivers are decreasing with time. This has been associated with steady increase of water and soil salinities. The reduction of flow is mainly due to the construction of dams in the upper reaches of the rivers basins and huge utilization of water for irrigation purposes. This is coupled with climate change that is affecting the region and causing decrease of annual precipitation with increase in temperatures.
Long term records as well as recent data indicate that the salinity of the Euphrates water is considered not acceptable for drinking purposes before it enters the Iraqi border while the Tigris water becomes unacceptable downstream Baghdad. Water quality deterioration in both rivers is due to several factors. As previously mentioned, construction of dams increased evaporation from the reservoirs. In addition, as more water is used for irrigation purposes the returned irrigation water is expected to seep back to the irrigation network at the absence of drainage systems. Moreover, even at the presence of such systems, drainage water is sometimes discharged directly to the rivers causing increase in salinity. The process is becoming more intensive with the increase of temperatures and decrease of precipitation due to climate change.
Other sources for water quality deterioration and pollution includes:
– Discharge of wastewater to the rivers.
– Discharging solid waste to the rivers.
– The use of AlTharthar reservoir water to back up Euphrates and Tigris rivers basins shortages
– Pollutions due to remnants of wars.
– Increase in water consumption due to high population growth rates.
Future prospects are more negative for all riparian countries. This implies that solving these problems requires actual and serious international, regional and national cooperation to set a prudent plan for water resources management of the two basins. Iraq being the most affected country should seriously set a prudent, scientific and strategic plan for the management and conservation of its water resources.
References
Abdulhadi, A., 2015, Overview of water Resources in Iraq, MSc thesis, College of Engineering, Alexandria University, Eygpt. Available at: https://www.researchgate.net/publication/304706450_Overview_of_water_Resources_in_Iraq last accessed February, 2018.
Abdullah, A. D., 2016, Modelling Approaches to understand Salinity Variation in Highly Dynamic Tidal River, The case of the Shatt Al-Arab River, PhD thesis, Delft University of Technology and of the Academic Board of the UNESCO-IHE, Delft, the Netherlands
AFED (Arab Forum for Environment and Development), 2009. Impact of Climate Change on Arab Countries, ISBN: 9953-437-28-9, http://www.afedonline.org.
Akanda, A., Freeman, S. and Placht, M. 2007. The Tigres-Euphrates River Basin: Mediating a Path Towards Regional Water Stability
Alalaf, I., 2009, Ilisu dam and its effect on man and environment in Iraq and Turkey, Batnaya, http://www.batnaya.net/forum/showthread.php?s=9bd97aa8bfae0b9b35554d8ce6c2787e&p=151263#post151263 last accessed January, 2018.
Al-Ansari, N.A.; Salameh, E. and Al-Omari, I., 1999, Analysis of Rainfall in the Badia Region, Jordan, Al al-Bayt University Research Paper No.1, 66p.
Al-Ansari, N.A. ,2013, Management of Water Resources in Iraq: Perspectives and Prognoses, J. Engineering, V.5, 8, 667-68.
Al-Ansari, N.A., Abdellatif, M., Zakaria, S., Mustafa, Y. and Knutsson, S. ,2014a, Future Prospects for Macro Rainwater Harvesting (RWH) technique in north east Iraq, J. Water Resource and Protection, 6, 5,403-420.
Al-Ansari, N.A., Abdellatif, M., Ezeelden, M., Ali, S. and Knutsson, S., 2014b, Climate Change and Future Long Term Trends of Rainfall at North-eastern Part of Iraq, J. Civil Engineering and Architecture, 8, 6,790-805.
Al-Ansari, N.A., Knutsson, S. and Almuqdadi, K., 2014c, Engineering solution for Radioactive Waste in IRAQ, J. Advance Science and Engineering Research, V. 4, No.1, 18-36.
Al-Ansari, N.A., Abdellatif, M., Ezeelden, M.,Ali, S. and Knutsson, S.,2014d, Climate Change and Future Long Term Trends of Rainfall at North-eastern Part of Iraq J. Civil Engineering and Architecture,V.8, 66,790-805.
Al-Ansari, N.A., Ali, A.A. and Knutsson, S., 2015, Iraq Water Resources Planning: Perspectives and Prognoses, ICCCE 2015: XIII International Conference on Civil and Construction Engineering, Jeddah, Saudi Arabia, 26-27 January, 2015,2097-2108.
Al-Ansari, N.A., 2016, Hydropolitics of the Tigris and Euphrates Basins, Engineering, 8, 3, 140-172.
Al Bomola A., 2011, Temporal and spatial changes in water quality of the Euphrates river – Iraq, MSc thesis, University of Lund, Lund Sweden.Available at http://lup.lub.lu.se/luur/download?func=downloadFile&recordOId=2341931&fileOId=2341934 Last accessed February, 2018.
Al-Daghastani, H. ,2013, Using Reflection Anomalies to Detect Radioactive Contaminations in Nineveh Governorate Northern Iraq, Earth Sciences and Geotechnical Eng., V.3, 3, 223-239.
Ali, S.,2013, Utilities of GIS and Remote Sensing Data in the Spatial Analysis of the Radioactive Contamination Site in Nineveh Province, Earth Sciences and Geotechnical Eng., V.3,3, 205-214.
Almuqdadi, K. and Al-Ansari, N.A.,2013a, Nature, Size and Contaminated Areas of the Waste of War in Iraq, J. Earth Sciences and Geotechnical Eng., V.3,3, 93-107.
Al-Muqdadi, K. and Al-Ansari, N.A. ,2013b, Risks of the Military uses of Depleted Uranium on Humans and the Environment, J. Earth Sciences and Geotechnical Eng., V.3,3,263-203.
Alsaka, L.Y., 2014, Concepts of Water Management among Riperian Coubtries (Iraq-Turkey- Syria) and its Implication on Water Quality and Quantity, J. University of Duhok,17,1,81-94.
Al-Shaab, T., 2017. Interview with the Iraqi Minister of Water Resources, 22nd June, 2017, Issue number 212, year 82. Available at: http://tareeqashaab.com/images/TariqPDF/2017/6/22.pdf last accessed 30 January, 2018
Bazzaz, F.,1993, Global climatic changes and its consequences for water availability in the Arab World, in Roger, R. and Lydon, P. (Ed.), Water in the Arab Word: Perspectives and Prognoses, Harvard University, 243- 252.
CEB (Consulting Engineering Bureau), 2011, Tigris and Euphrates sampling, Final Report, College of Engineering, University of Baghdad, Iraq.
Chenoweth, J. Hadjinicolaou, P., Bruggeman, A., Lelieveld, J., Levin, Z., Lange, M.A., Xoplaki, E. and Hadjikakou, M., 2011, Impact of climate change on the water resources of the eastern Mediterranean and Middle East region: Modelled 21st century changes and implications, Water Resources Research, 47, 6, 1-18.
Chulov, M. ,2010, Iraq littered with high levels of nuclear and dioxin contamination, study finds, guardian.co.uk, 22 January 2010.
ESCWA (Economic and Social Commission for Western Asia) ,2013, Inventory of Shared Water Resources in Western Asia, Salim Dabbous Printing Co., Beirut, Lebanon, 626p.
DAI Washington.,2006, Iraq Marshlands restoration program: Final report, Washington, DC: United States Agency for International Development.
FAO (Food and Agricultural Organization), 2003, Towards sustainable agricultural development in Iraq: The Transition from Relief, Rehabilitation and Reconstruction to Development. 222 pp. Available at http://www.fao.org/docrep/006/y9870e/y9870e00.htm Last accessed in February, 2018
FAO (Food and Agricultural Organization), 2009a, Turkey, Water Report 34. http://www.fao.org/nr/water/aquastat/countries_regions/TUR/ Last accessed February, 2018
FAO (Food and Agricultural Organization), 2009b, Syria, Water Report 34. http://www.fao.org/nr/water/aquastat/countries_regions/SYR/ Last accessed February, 2018
FAO (Food and Agricultural Organization), 2009c, Iraq, Water Report 34. http://www.fao.org/nr/water/aquastat/countries_regions/IRQ/ Last accessed February, 2018.
Fathi, R., Matti, L., Al-Salih, H. and Godbold, D. ,2013, Environmental pollution by depleted uranium in Iraq with special reference to Mosul and possible effects on cancer and birth defect rates, J. Medicine, Conflict and Survival, V. 29,1,7-25.
Geopolicity, 2010, Managing the Tigris-Euphrates watershed: The challenge facing Iraq, part III structural drivers of change, p 24.
Hameed, M.; Ahmadalipour, A.; Moradkhani, H., 2018, Apprehensive Drought Characteristics over Iraq: Results of a Multidecadal Spatiotemporal Assessment, J. Geosciences, 8,58,1-16.
Hiniker, M., 1999, Sustainable Solutions to Water Conflicts in the Jordan Valley. Geneva: Green Cross International.
IAU (Inter- Agency Information and Analysis), 2010, Inter-Agency Information and Analysis Unit Report, “Water in Iraq Fact sheet”. Available at: https://reliefweb.int/sites/reliefweb.int/files/resources/A1F9733337B9CE83C12577C90032CCED-Full_Report.pdf Last accessed February, 2018.
IPCC, Intergovernmental Panel on Climate Change, 2007a, Climate change 2007: climate change impacts, adaptation and vulnerability. Cambridge University Press, Geneva.
Hillel D., 1994, Rivers of Eden: The Struggle for Water and the Quest for Peace in the Middle East, Oxford University Press, New York.
Kavvas, M.L, Chen, R.Z.Q., Anderson, M.L., Ohara N., Yoon., 2006, A regional hdroclimatic data over the watershed.
Kliot, N. ,1994, The Geopolitics of Inequality: The Tigris-Euphrates Drainage Basin. In Water Resources and Conflict in the Middle East. Published by Routledge. London/New York.
Maddocks; A.; Young, R.S. and Reig P., 2015, Ranking the World’s Most Water-Stressed Countries in 2040, World Resources Institute. Available at: http://www.wri.org/blog/2015/08/ranking-world%E2%80%99s-most-water-stressed-countries-2040 Last accessed February, 2018.
Majeed, Y. A., 1993, The central Regions: Problems and Perspectives, in Roger, R. and Lydon, P. (Ed.), Water in the Arab Word: Perspectives and Prognoses, Harvard University, 101-120.
MICS (Multiple Indicator Cluster Survey), 2011, IRAQ: Monitoring the situation of children and Women, Final Report, https://mics-surveys-prod.s3.amazonaws.com/MICS4/Middle%20East%20and%20North%20Africa/Iraq/2011/Final/Iraq%202011%20MICS_English.pdf Last accessed February 20, 2018.
Ministry of Environment,2010, National report on biodiversity in Iraq, July 2010, (some information), available at http://www.cbd.int/doc/world/iq/iq-nr-04-en.pdf, Other information from Geography and population, available at http://www.fao.org/docrep/W4356E/w4356e0e.htm. last accessed February, 2018.
Osman, Y; Al-Ansari, N.A. and Abdellatif, M., 2017a, Climate Change Model as a Decision Support Tool for Water Resources Management: A case Study of Greater Zab River, J. Water and Climate Change, 8, 8, 1-14.
Osman Y.; Abdellatif, M.; Al-Ansari, N.A.; Knutsson, S., and Aljawad S.B., 2017b, Climate Change and Future Precipitation in Arid Environment of Middle East: Case study of Iraq, J. Environmental Hydrology, 25, paper 3, 1-18.
Population Reference Bureau, 2015, World Population Data with a special focus on women’s. Availablle at: http://www.prb.org/pdf15/2015-world-population-data-sheet_eng.pdf Last accessed Frebruary, 2018
Proyect, L., 2018, Iran`s Water Crisis, Counter punch, January 10, 2018. Available at: https://www.counterpunch.org/2018/01/10/irans-water-crisis/ last accessed 30 January, 2018.
Sadik, A. and Barghouti, S., 1994, The water problems of the Arab world: Management of scarce water resources, In Rogers, P. and Lydon, P. (eds.), Water in the Arab World. Massachusetts, USA:Harvard University Press. 4-37.
Schnepf, R. ,2003, Iraq’s Agriculture: Background and Status, Congressional Research Service, The Library of Congress.Available at http://nationalaglawcenter.org/wp-content/uploads/assets/crs/RS21516.pdf last accessed February, 2018.
Shahin, M., 2007, Water Resources and Hydrometorology of the Arab Region, Springer, The Netherlands, Dordrecht. ISBN-13 978-1-4020-4577-6
Sharifikia, M., 2013.Environmental challenges and drought hazard assessment of Hamoun Desert Lake in Sistan region, Iran, based on the time series of satellite imagery, J. Natural Hazards, 65, 201-217, DOI 10.1007/s11069-012-0353-8.
Sissakian, V.K., 2011, Origin of the Tharthar Depression, Central part of Iraq. Iraqi Bulletin of Geology and Mining, Vol. 7, No.3, p. 47 – 62.
Sissakian, V., Al-Ansari, N.A. and Knutsson, V., 2013, Sand and dust storm events in Iraq, J. Natural Science, V 5, 10, 1084-1094.
Sluglett, P., 2003, The international context of Iraq from 1980 to the present, In E. Nicholson, & P. Clark eds., The Ira New Eden master plan for the integrated water resources management in the Marshland area, Politico’s Publishing.
Taylor and Francis Group, 2003, The Middle East and North Africa, 49th Edition, Taylor and Francis, London.Available at: https://books.google.se/books?id=4CfBKvsiWeQC&pg=PR3&lpg=PR3&dq=taylor/francis+group.+2002.+the+middle+east+and+north+africa+2003.&source=bl&ots=Sg2I1qCBjN&sig=vdePDEki0bnvzFlZ6pOu8MBWXJw&hl=en&sa=X&ved=0ahUKEwjNm4_GxbbZAhUG_KQKHW2jBtQQ6AEIKTAA#v=onepage&q=taylor%2Ffrancis%20group.%202002.%20the%20middle%20east%20and%20north%20africa%202003.&f=false Last accessed February, 2018.
Tkachenko, A., The economy of the Iraqi Marshes in the 1990s. In E.
Nicholson, & P. Clark, eds.,2003, The Iraqi Marshlands: A human and environmental study,2nd ed., London: Politico’s Publishing, 36-63.
UN, 2010, Water Resources Management White Paper, United Nations Assistance Mission for Iraq, United Nations Country Team in Iraq, 20p.
UN Water, 2016, Water and Jobs facts and figures, The United Nations World Water Development Report,12p. Available at http://unesdoc.unesco.org/images/0024/002440/244041e.pdf Last accessed February, 2018.
UNEP (United Nations Environmental Program), 2003, Desk Study on the environment of Iraq. Switzerland, p 96.
UNDP (United Nations Development Program), 2011, Drought Impact Assessment, Recovery and Mitigation Framework and Regional Project Design in Kurdistan Region (KR), p 79.Available at: http://www.undp.org/content/dam/rbas/report/Drought.pdf last accessed February, 2018.
UNICEF, 2003, Iraq watching briefs, Water and Environmental Sanitation, 64p. 8 https://www.unicef.org/evaldatabase/index_29697.html Last accessed February 20, 2018.
Voss, K.A., Famiglietti, J.S., Lo, M.H., Linage, C., Rodell, M. and Swenson, S., 2013, Groundwater depletion in the Middle East from GRACE with implications for transboundary water management in the Tigris-Euphrates-Western Iran region, Water Resources Research, V.49,2,904-914.
Wikipedia, 2018, Mesopotamia. Available at https://simple.wikipedia.org/wiki/Mesopotamia Last accessed March, 2018.
Worldmeters,2008, Countries in the world by population.Available at: http://www.worldometers.info/world-population/population-by-country/ Last accessed February, 2018.
Zwijnenburg, W.,2013, In the state of Uncertainty: Impact and implications of the use of deleted uranium in Iraq, IKV PAX CHRISTI report, 52p. www.ikvpaxchristi.nl